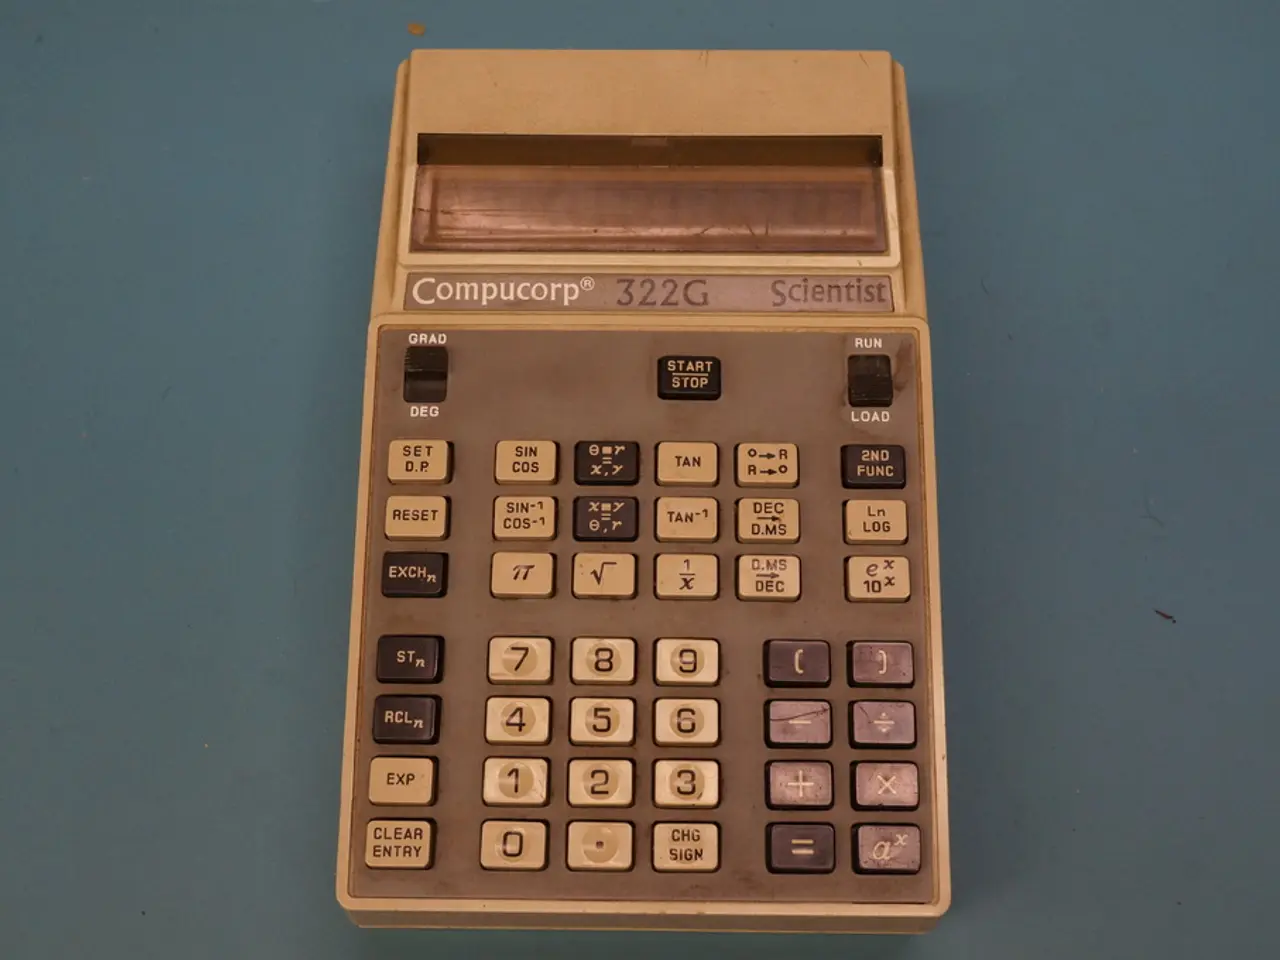
Calculator for Computing Variance via Standard Deviation
In the realm of data analysis, standard deviation stands out as a crucial metric, offering valuable insights across various fields. This statistical measure, which quantifies the dispersion or variability within a data set, is instrumental in gauging the precision of tools, the reliability of data, and managing risk.
In finance, standard deviation is widely used to evaluate investment risk or volatility. By quantifying how much the return on an investment deviates from its average return, it helps investors assess the riskiness of different assets and construct diversified portfolios accordingly. A higher standard deviation indicates greater variability and thus higher risk, while a lower standard deviation suggests more stable returns.
Standard deviation also plays a significant role in scientific research and healthcare. In clinical trials, it helps compare consistency in treatment effects among groups, indicating how uniformly a drug performs. In epidemiology, it is used to monitor disease trends by analysing fluctuations in case numbers over time. If current disease incidence deviates significantly from historical averages, it may signal emerging outbreaks or changes in disease dynamics.
Manufacturers apply standard deviation to monitor product consistency and minimise defects. A low standard deviation in product weight or component lifespan signals high consistency and quality, which builds customer trust and reduces waste. Conversely, high variance can alert managers to potential issues like faulty machinery or process instability.
In weather forecasting and environmental science, standard deviation helps quantify variability in weather parameters such as temperature or rainfall. Understanding the degree of fluctuation allows meteorologists to produce more reliable forecasts and climate models, and to communicate the uncertainty inherent in weather predictions.
Standard deviation also finds applications in sports, data science, machine learning, retail analysis, and climatology. In sports, it measures performance consistency, indicating how predictable or variable an athlete’s or team’s results are over time. In data science and machine learning, it is used for feature scaling, detecting outliers, and evaluating model performance by measuring prediction errors. Retail analysts track sales fluctuations using standard deviation to identify inconsistent product performance and optimise inventory. In climatology, standard deviation assists in comprehending the fluctuations in climate data.
Calculating standard deviation involves determining the mean of the data set, calculating the variance, and then taking the square root of the variance. The interpretation of standard deviation provides a window into understanding the data's spread and its adherence or deviation from the mean.
In real-world scenarios, a low standard deviation indicates consistency and low variability, which might be interpreted as reliability in certain contexts. Conversely, a higher standard deviation denotes a wider spread, implying high variability. In a normal distribution (bell curve), approximately 68% of the data falls within one standard deviation of the mean, while the Empirical Rule states that 95% of the data falls within two standard deviations, and 99.7% falls within three standard deviations.
In manufacturing and quality control, standard deviation is used to create control charts that help monitor and control the quality of processes. A process is considered in control if data points are within acceptable limits, determined by specific standard deviations from the process mean. In the financial realm, standard deviation is employed to estimate the risk associated with financial assets. If data points fall outside the limits, it may indicate that the process is out of control, prompting further investigation and corrective actions.
In conclusion, standard deviation is essential for understanding and managing variability, making informed decisions, and improving outcomes across diverse disciplines. Whether in finance, science, weather forecasting, or manufacturing, this versatile statistical measure serves as a key tool in quantifying variability or risk, ensuring reliable and repeatable results, and driving progress in the modern world.
- Data analysts utilize standard deviation in education-and-self-development and learning to measure the consistency of students' performance, providing valuable insights for teachers to optimize educational strategies.
- In the media and politics, standard deviation is applied to analyze the behavior of voters, predicting voting patterns and election outcomes based on polling statistics.
- By examining the standard deviation of news reading habits among different demographics, researchers can gain insights into public attitudes and opinions towards various topics.
- Podcast analytics often include standard deviation to evaluate audience engagement and determine the format's effectiveness, attracting advertisers and sponsors.
- In the field of research, specifically social sciences, standard deviation helps quantify the variability in behavior among study participants, enabling researchers to make informed conclusions about trends and patterns.
- Weather forecasters use standard deviation to forecast temperature swings, helping people make decisions regarding clothing, transportation, and outdoor activities based on the predicted forecast's accuracy.
- By analyzing fluctuations in student grades using standard deviation, educators can identify patterns, track progress, and adjust teaching methods to improve learning outcomes.


